
Night’s Watch
Data Monitoring Dashboard
Night’s Watch
Data Monitoring Dashboard
Night’s Watch
Data Monitoring Dashboard
2020-2021
2020-2021
2020-2021

Designing and developing a model execution monitoring application with built-in detective, corrective, and preventative controls to consistently ensure reliable data.
Designing and developing a model execution monitoring application with built-in detective, corrective, and preventative controls to consistently ensure reliable data.
Designing and developing a model execution monitoring application with built-in detective, corrective, and preventative controls to consistently ensure reliable data.
✨ Overview
✨ Overview
✨ Overview
ROLE
ROLE
ROLE
Full Time
Full Time
Full Time
Product Designer
Product Designer
Product Designer
Lead UI Design, Lead UX Design, Research, Rapid Prototyping, User Flows, User Testing, Empathy Interviews
Lead UI Design, Lead UX Design, Research, Rapid Prototyping, User Flows, User Testing, Empathy Interviews
Lead UI Design, Lead UX Design, Research, Rapid Prototyping, User Flows, User Testing, Empathy Interviews
Software Engineer
Software Engineer
Software Engineer
Development, Documentation, Internal Launch, Maintenance
Development, Documentation, Internal Launch, Maintenance
Development, Documentation, Internal Launch, Maintenance
PLATFORM
PLATFORM
PLATFORM
Web
Web
Web
TIMELINE
TIMELINE
TIMELINE
2020-2021
2020-2021
2020-2021
STATUS
STATUS
STATUS
Shipped to Capital One Internal Users
Shipped to Capital One Internal Users
Shipped to Capital One Internal Users
DELIVERABLES
DELIVERABLES
DELIVERABLES
Design
Design
Design
User Flow, Wireframes, High-Fidelity Prototype, Future Concepts
User Flow, Wireframes, High-Fidelity Prototype, Future Concepts
User Flow, Wireframes, High-Fidelity Prototype, Future Concepts
Code
Code
Code
Responsive Web Product, Documentation
Responsive Web Product, Documentation
Responsive Web Product, Documentation
OVERVIEW
OVERVIEW
OVERVIEW
As my first job as a full-time software engineer, I was tasked with redesigning and developing new pages and features for a model monitoring dashboard. Our data science and engineering teams were having to navigate around various different forms of communication and AWS in order to monitor a single data science model among many. Our goal was to create a one-stop-shop so that our engineers and data partners can save time while monitoring our models, detecting failures, preventing bad data, accessing relevant logs, and taking relevant actions to ensure 100% accuracy and reliability in our data.
I was the only frontend engineer among backend engineers, so I naturally took on the role of designer. With direct and easy access to those who will be using the application, collaboration and empathy interviews allowed my designs to focus on alleviating the true pain points of our teams. In one year, I fully redesigned and developed our Night’s Watch Model Execution Monitoring application in React and Javascript. Our data and engineering teams were now able to make efficient use of their time when debugging or monitoring data.
❗️Disclaimer: Due to the confidential nature of the project being an internal application, all images are representations of the actual work.
❗️Disclaimer: Due to the confidential nature of the project being an internal application, all images are representations of the actual work.
❗️Disclaimer: Due to the confidential nature of the project being an internal application, all images are representations of the actual work.
✨ Highlights
✨ Highlights
✨ Highlights
✨ The Challenge
✨ The Challenge
✨ The Challenge

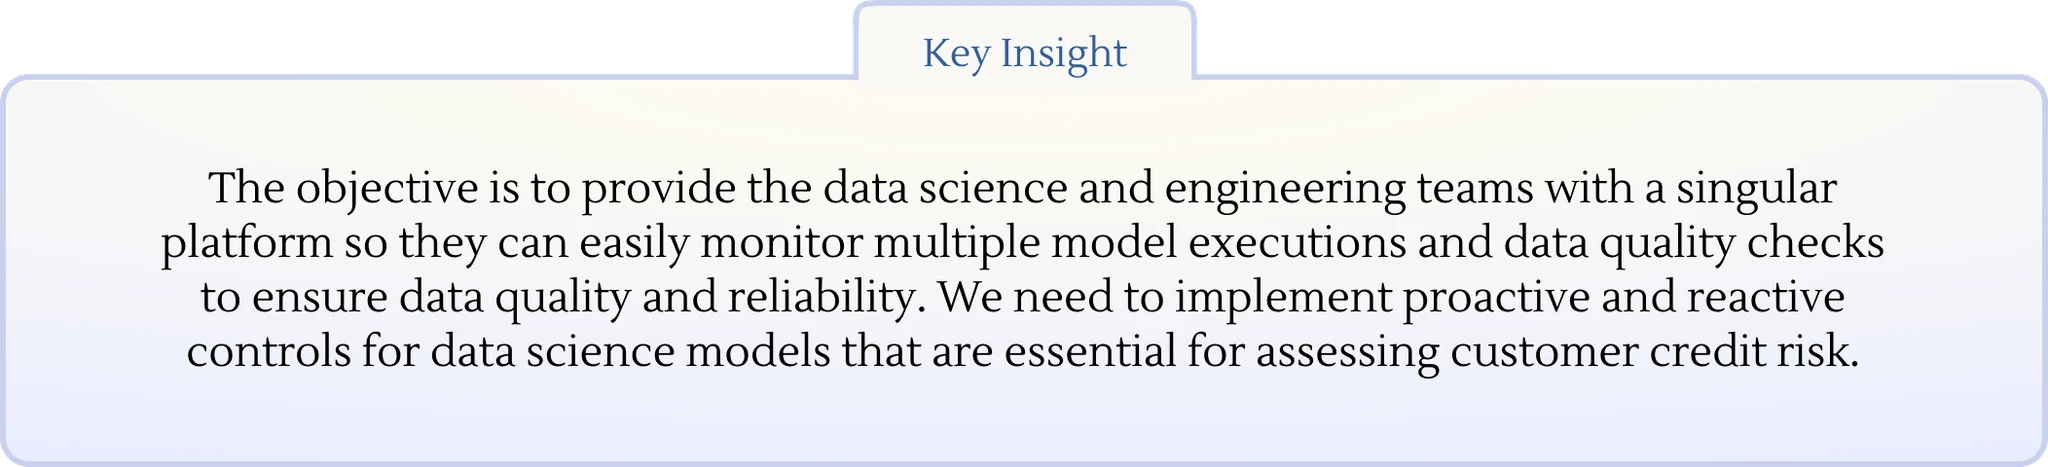
Our data science and engineering teams were having to sift through a multitude of communication channels and AWS sites to complete a single task of monitoring one data science model. These models are critical to Capital One for determining the credit risk of a customer’s account. Let’s say you want a credit limit increase on your Capital One credit card. These models help determine if you are eligible for that.
Our data science and engineering teams were having to sift through a multitude of communication channels and AWS sites to complete a single task of monitoring one data science model. These models are critical to Capital One for determining the credit risk of a customer’s account. Let’s say you want a credit limit increase on your Capital One credit card. These models help determine if you are eligible for that.
Our data science and engineering teams were having to sift through a multitude of communication channels and AWS sites to complete a single task of monitoring one data science model. These models are critical to Capital One for determining the credit risk of a customer’s account. Let’s say you want a credit limit increase on your Capital One credit card. These models help determine if you are eligible for that.
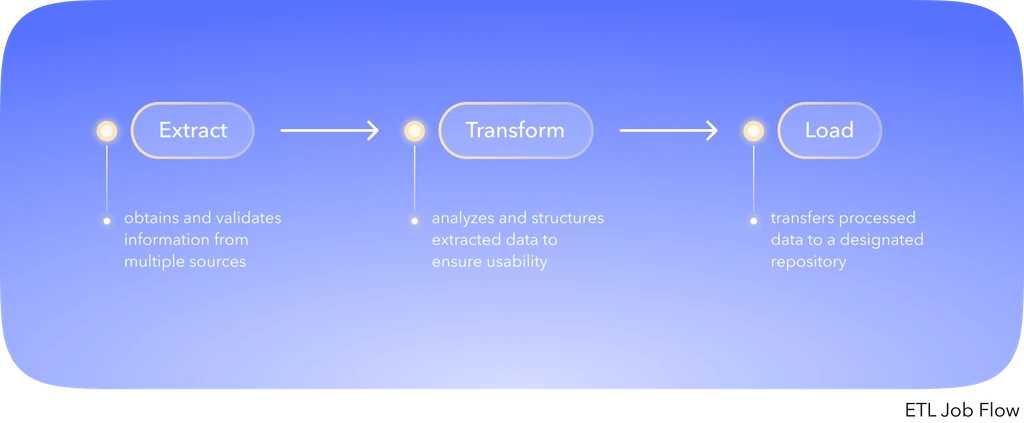
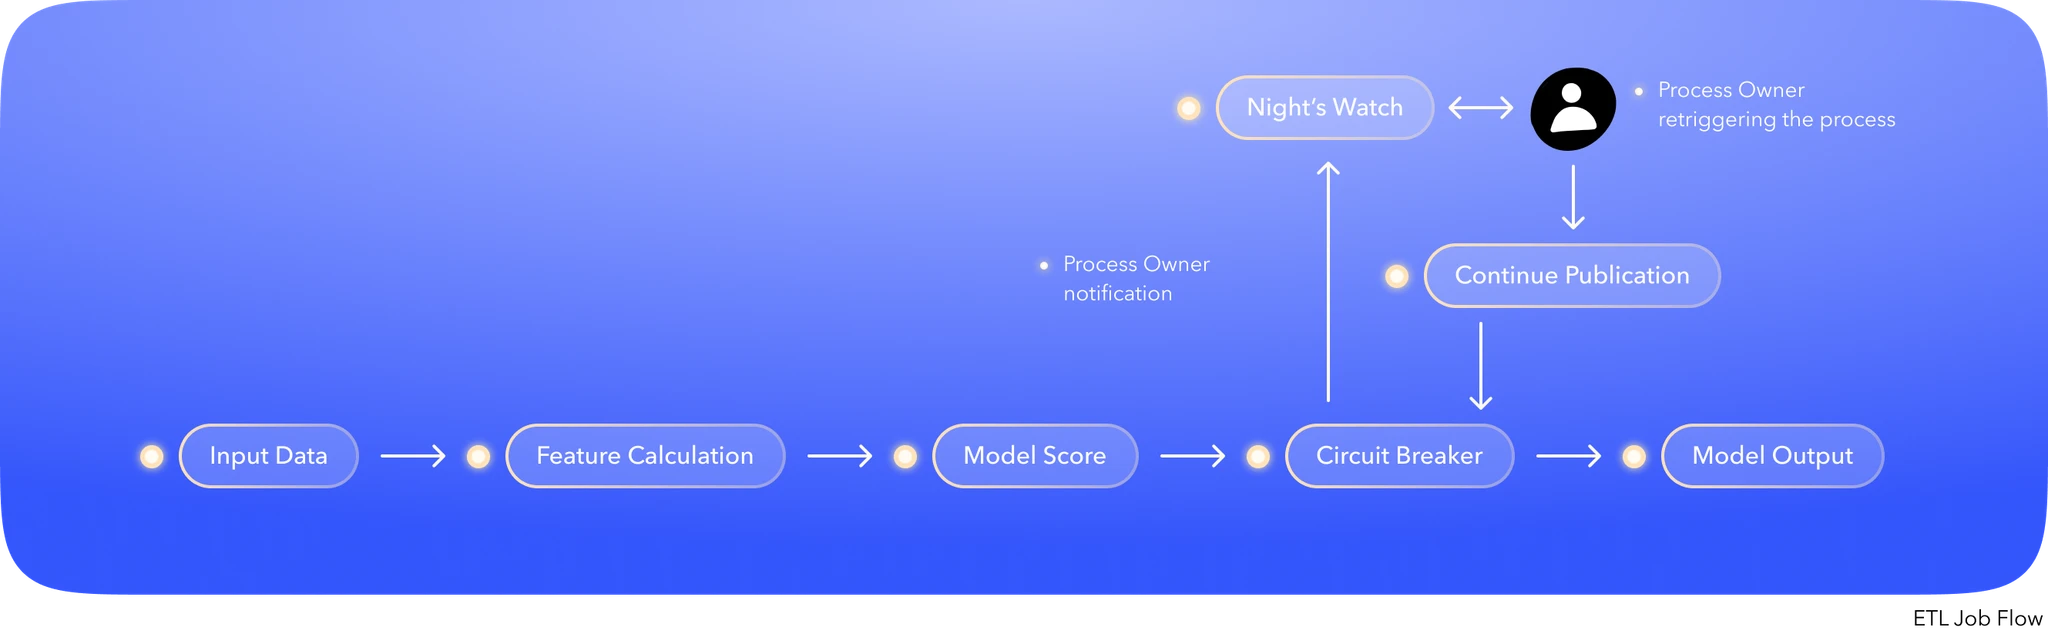
The model data is from ETL jobs which our team also maintains. ETL means we extract only relevant data, transform the data to our needs, and load the data for our application. The team had to do this for a multitude of models per day so that the time sink compounded.
The model data is from ETL jobs which our team also maintains. ETL means we extract only relevant data, transform the data to our needs, and load the data for our application. The team had to do this for a multitude of models per day so that the time sink compounded.
The model data is from ETL jobs which our team also maintains. ETL means we extract only relevant data, transform the data to our needs, and load the data for our application. The team had to do this for a multitude of models per day so that the time sink compounded.

Problem Framing
Problem Framing

Execution monitoring pain points: data quality errors are difficult to identify, and a high volume of false positive alerts reduces the effectiveness of monitoring.
Execution monitoring pain points: data quality errors are difficult to identify, and a high volume of false positive alerts reduces the effectiveness of monitoring.
Execution monitoring pain points: data quality errors are difficult to identify, and a high volume of false positive alerts reduces the effectiveness of monitoring.

Reactive monitoring: complicates preventing errors once data has already been published and ingested downstream.
Reactive monitoring: complicates preventing errors once data has already been published and ingested downstream.
Reactive monitoring: complicates preventing errors once data has already been published and ingested downstream.

Limited transparency: makes it challenging for engineers to identify and resolve issues in the data processing pipeline.
Limited transparency: makes it challenging for engineers to identify and resolve issues in the data processing pipeline.
Limited transparency: makes it challenging for engineers to identify and resolve issues in the data processing pipeline.

Fragmented monitoring and checks: hinders the ability to fully understand issues and their impact on other processes.
Fragmented monitoring and checks: hinders the ability to fully understand issues and their impact on other processes.
Fragmented monitoring and checks: hinders the ability to fully understand issues and their impact on other processes.
✨ The Solution
✨ The Solution
✨ The Solution
Our Goals
Our Goals
Otherwise, the teams would have to perform all the tasks manually for each model, spending much of their day monitoring instead of other important tasks.
Otherwise, the teams would have to perform all the tasks manually for each model, spending much of their day monitoring instead of other important tasks.
Otherwise, the teams would have to perform all the tasks manually for each model, spending much of their day monitoring instead of other important tasks.
High Level Goals
High Level Goals
Build a model execution monitoring application designed and developed to ensure data accuracy and reliability.
Build a model execution monitoring application designed and developed to ensure data accuracy and reliability.
Build a model execution monitoring application designed and developed to ensure data accuracy and reliability.
Ensure models produce 100% accurate data by performing data quality checks, monitoring, metrics, alerting, and taking actions such as terminating or triggering clusters.
Ensure models produce 100% accurate data by performing data quality checks, monitoring, metrics, alerting, and taking actions such as terminating or triggering clusters.
Ensure models produce 100% accurate data by performing data quality checks, monitoring, metrics, alerting, and taking actions such as terminating or triggering clusters.
Design for use by developers and data science teams.
Design for use by developers and data science teams.
Design for use by developers and data science teams.

Enhance visibility into daily execution processes.
Enhance visibility into daily execution processes.
Enhance visibility into daily execution processes.

Help prevent data errors and mitigate risks, including regulatory, financial, and reputational risks.
Help prevent data errors and mitigate risks, including regulatory, financial, and reputational risks.
Help prevent data errors and mitigate risks, including regulatory, financial, and reputational risks.

Make detecting and preventing data errors more efficient.
Make detecting and preventing data errors more efficient.
Make detecting and preventing data errors more efficient.
✨ Design Process
✨ Design Process
✨ Design Process
Tools
Tools

High Level Audit
High Level Audit
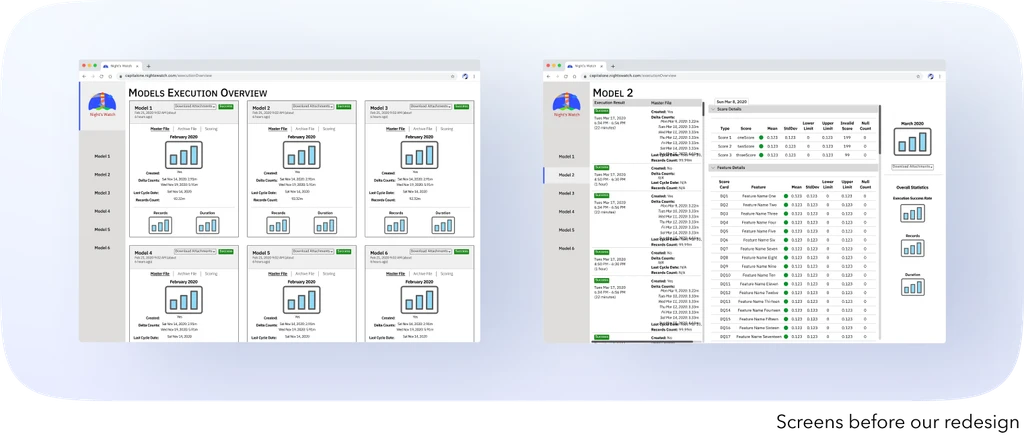
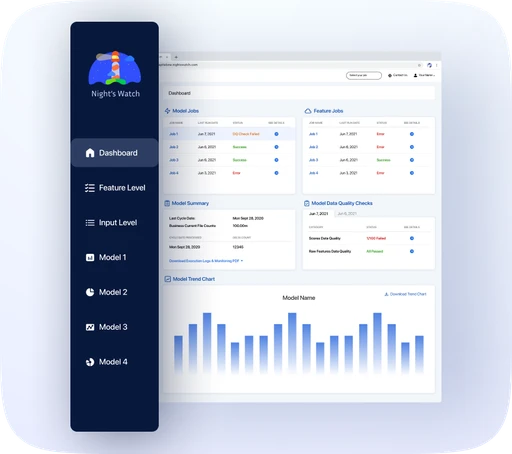
In the beginning, the application had too much information on the screen and was not actionable or glanceable by our users. Our goal was to show only relevant data so that the user is not overwhelmed and the information is more easily digestible.
In the beginning, the application had too much information on the screen and was not actionable or glanceable by our users. Our goal was to show only relevant data so that the user is not overwhelmed and the information is more easily digestible.
In the beginning, the application had too much information on the screen and was not actionable or glanceable by our users. Our goal was to show only relevant data so that the user is not overwhelmed and the information is more easily digestible.
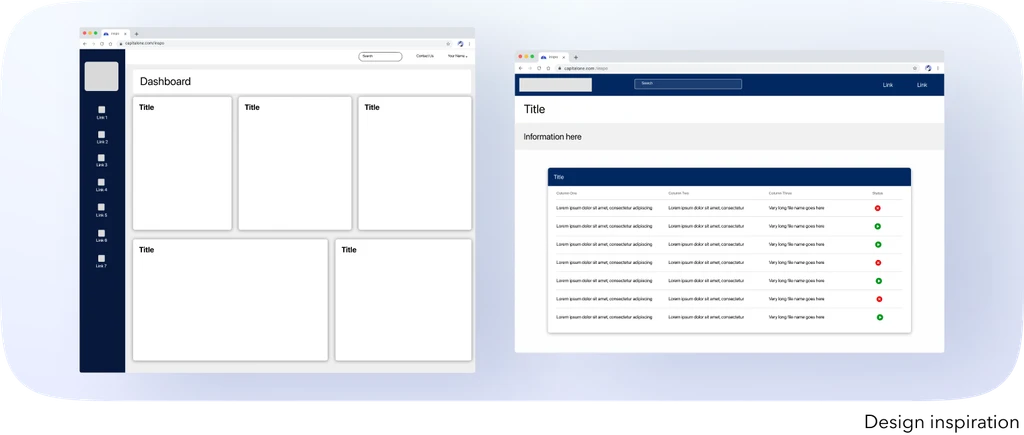
At the time, there was no enterprise-wide design system, and because this was an internal tool, there were no design guidelines for me to strictly follow. I pulled from other internal tools and dashboards to look for inspiration.
At the time, there was no enterprise-wide design system, and because this was an internal tool, there were no design guidelines for me to strictly follow. I pulled from other internal tools and dashboards to look for inspiration.
At the time, there was no enterprise-wide design system, and because this was an internal tool, there were no design guidelines for me to strictly follow. I pulled from other internal tools and dashboards to look for inspiration.
Research
Research
As a starting point, I spent some time learning more about human-centered design, designing for large datasets and dashboards, and table designs. Here are some key takeaways:
As a starting point, I spent some time learning more about human-centered design, designing for large datasets and dashboards, and table designs. Here are some key takeaways:
As a starting point, I spent some time learning more about human-centered design, designing for large datasets and dashboards, and table designs. Here are some key takeaways:
address the core needs of those experiencing a problem
address the core needs of those experiencing a problem
address the core needs of those experiencing a problem
focus on the perspective of the user
focus on the perspective of the user
focus on the perspective of the user
have critical and pertinent data at a glance
have critical and pertinent data at a glance
have critical and pertinent data at a glance
start with the high level overview and provide paths with increasing levels of specificity
start with the high level overview and provide paths with increasing levels of specificity
start with the high level overview and provide paths with increasing levels of specificity

for tables, consider row style, clear contrast, visual cues, and alignment
for tables, consider row style, clear contrast, visual cues, and alignment
for tables, consider row style, clear contrast, visual cues, and alignment
Our Target Users
Our Target Users

Model Developers
Model Developers
Model Developers
can assess data quality through feature and score level metrics, gain insights into changes that may impact model outputs, and receive notifications for any data quality failures.
can assess data quality through feature and score level metrics, gain insights into changes that may impact model outputs, and receive notifications for any data quality failures.
can assess data quality through feature and score level metrics, gain insights into changes that may impact model outputs, and receive notifications for any data quality failures.

Data Consumers
Data Consumers
Data Consumers
can assess data quality through feature and score level metrics, with notifications alerting them to load delays, data issues, or possible data reloads.
can assess data quality through feature and score level metrics, with notifications alerting them to load delays, data issues, or possible data reloads.
can assess data quality through feature and score level metrics, with notifications alerting them to load delays, data issues, or possible data reloads.

Product teams
Product teams
Product teams
can monitor the health of the processing pipeline by reviewing daily execution details and leveraging application-level monitoring. They can receive alerts for critical pipeline failures, such as connectivity or infrastructure issues.
can monitor the health of the processing pipeline by reviewing daily execution details and leveraging application-level monitoring. They can receive alerts for critical pipeline failures, such as connectivity or infrastructure issues.
can monitor the health of the processing pipeline by reviewing daily execution details and leveraging application-level monitoring. They can receive alerts for critical pipeline failures, such as connectivity or infrastructure issues.
✨ Iterations
✨ Iterations
✨ Iterations
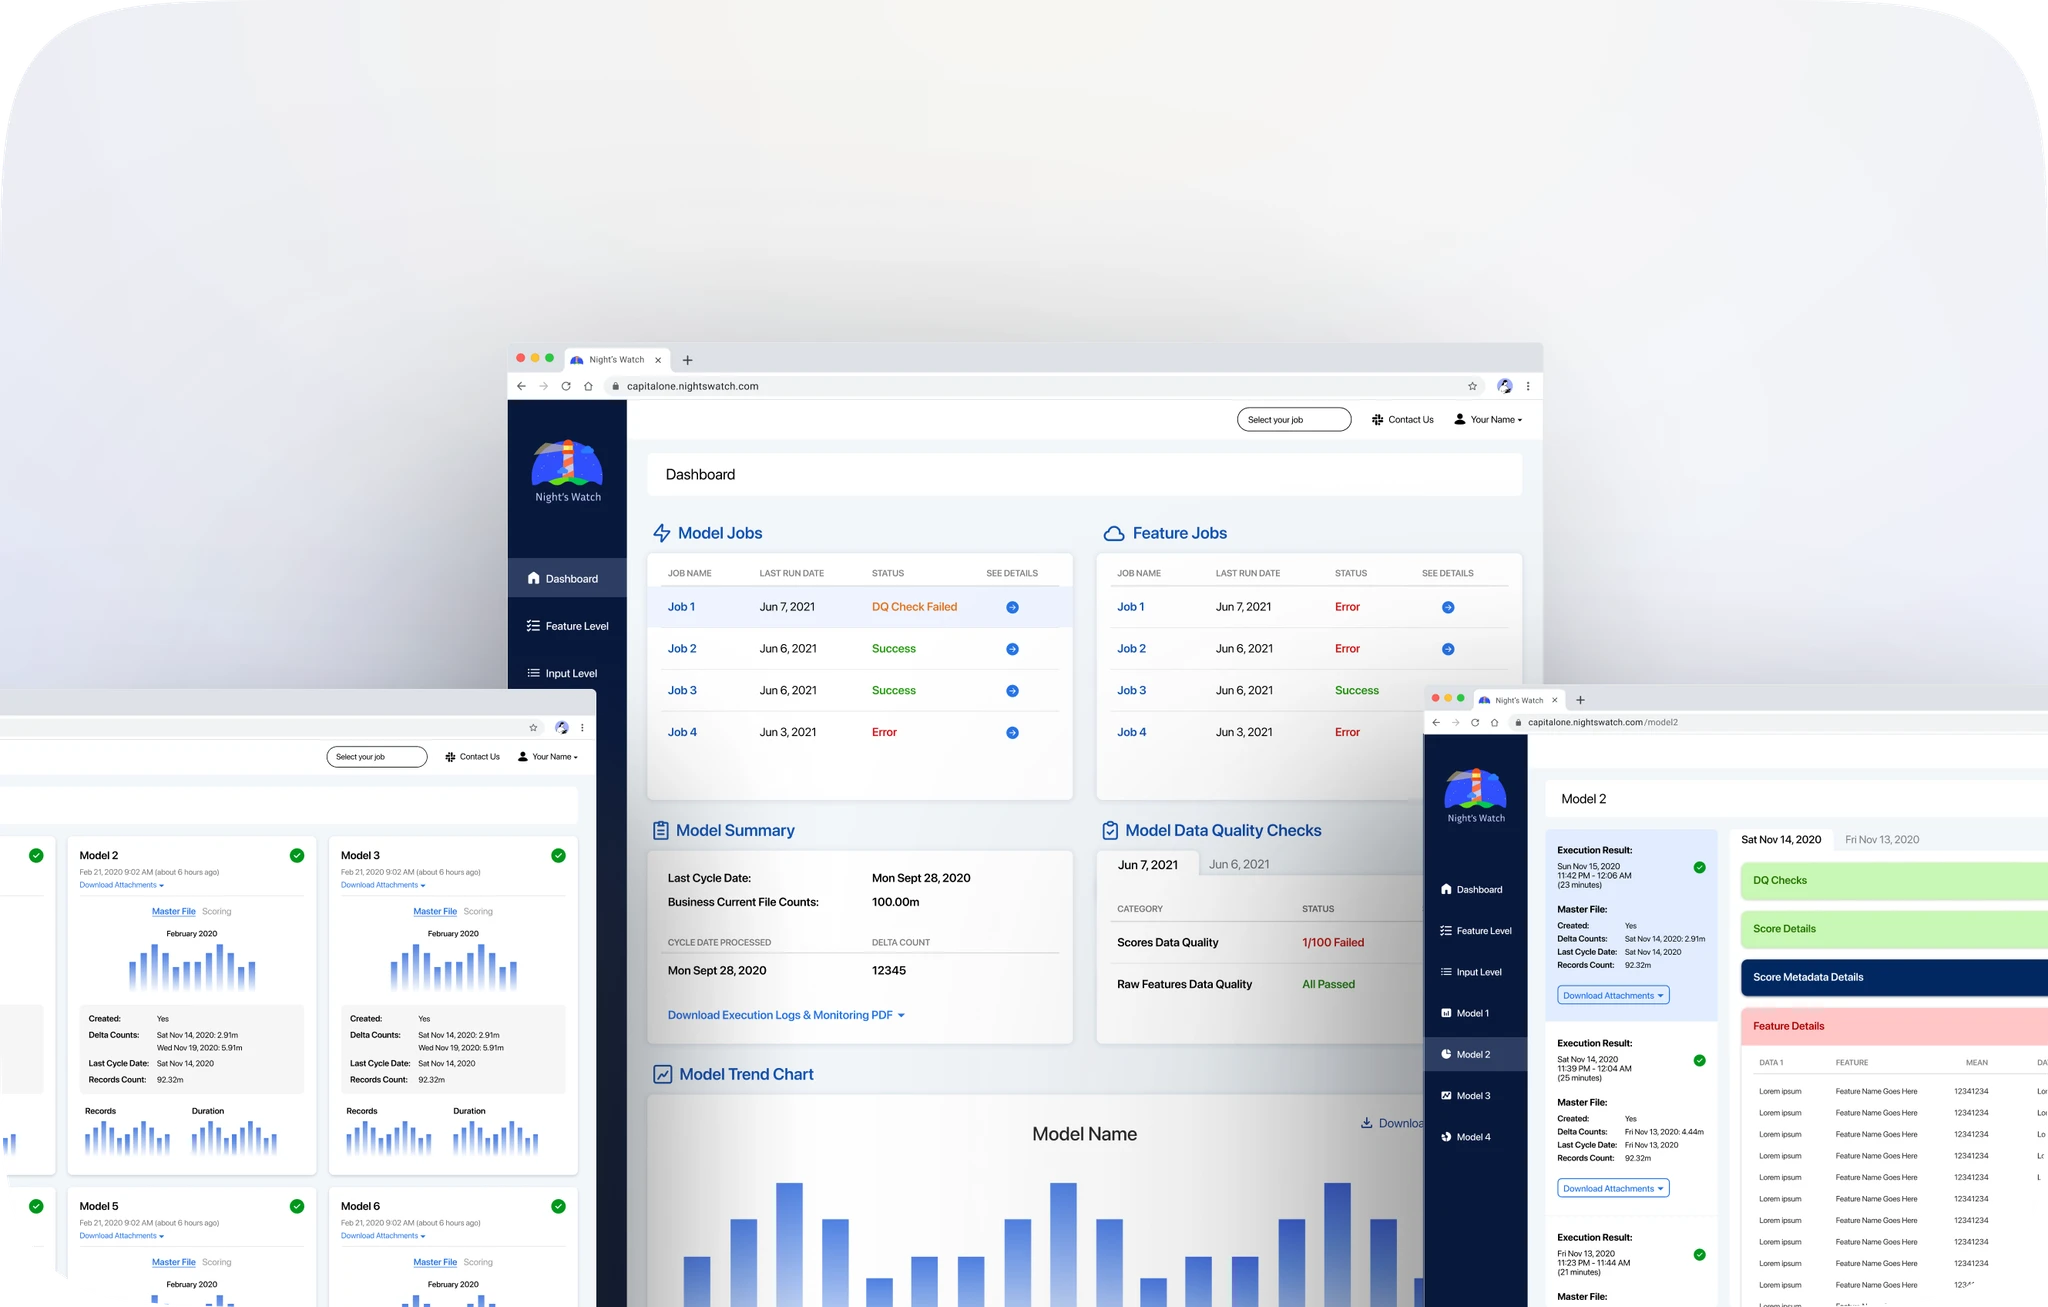
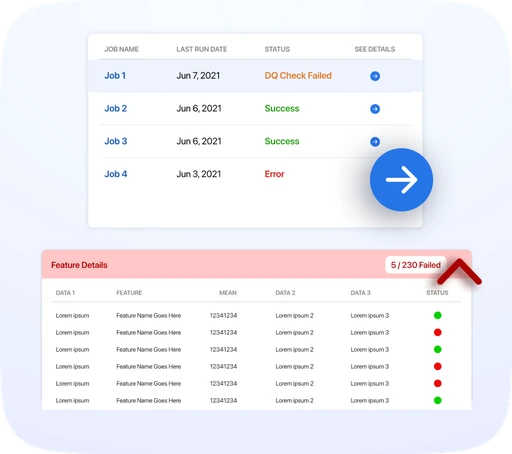
Dashboard Redesign
Dashboard Redesign

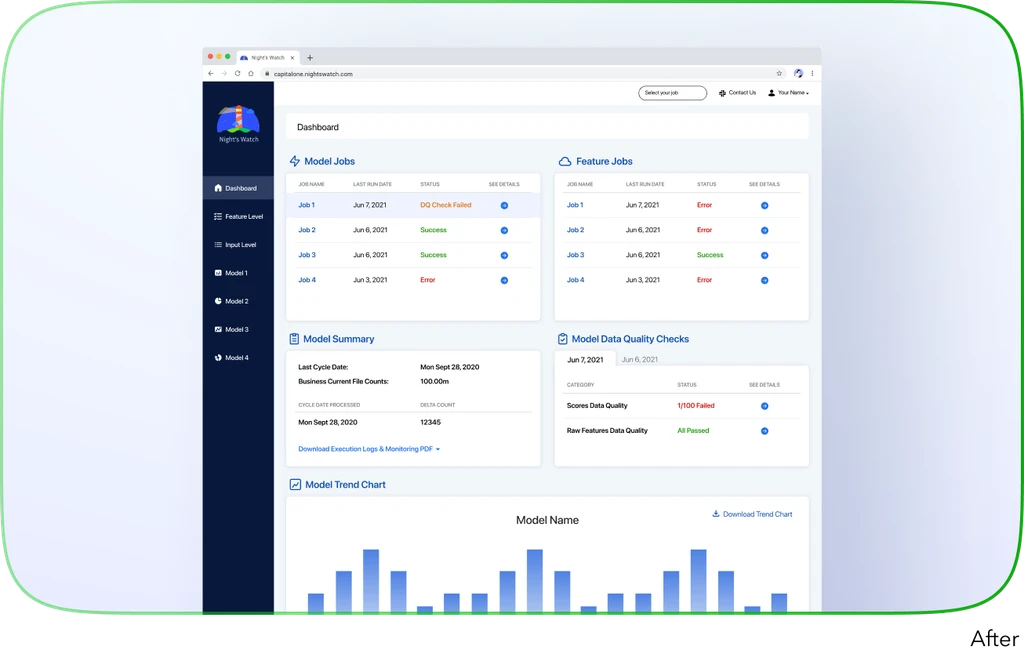
Improvements: glanceable with only relevant data and use of colors, easy communication with contact channels at the top, clear headers, actionable components, and easier to read and digest
Improvements: glanceable with only relevant data and use of colors, easy communication with contact channels at the top, clear headers, actionable components, and easier to read and digest
Improvements: glanceable with only relevant data and use of colors, easy communication with contact channels at the top, clear headers, actionable components, and easier to read and digest
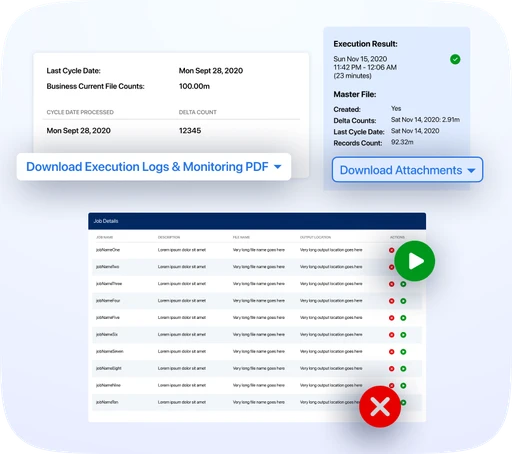
Model Summary Page Redesign
Model Summary Page Redesign

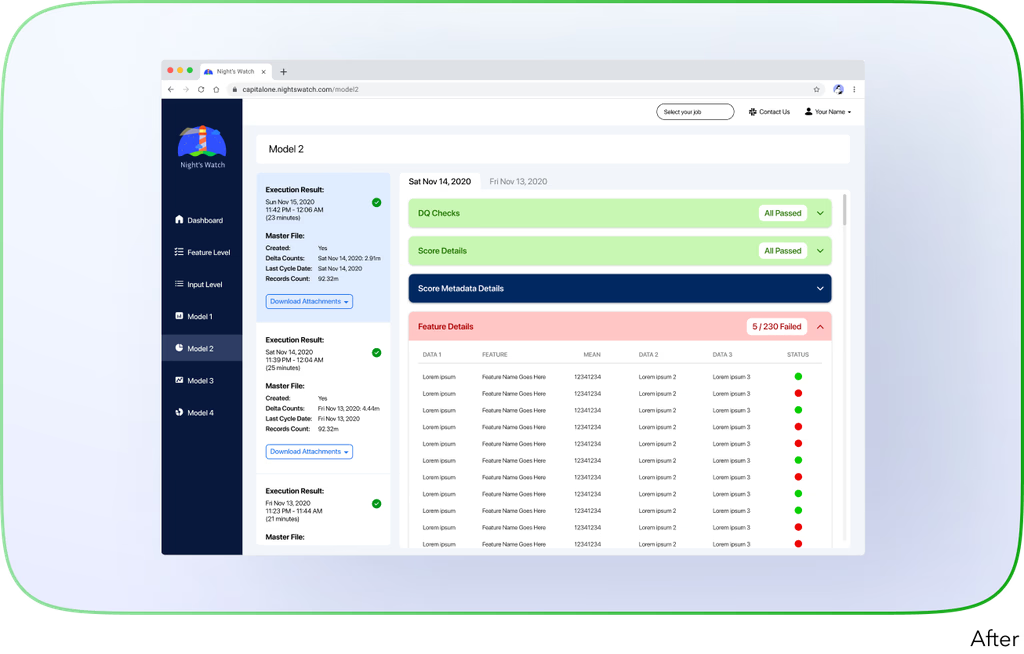
Improvements: only show relevant data, use colors to indicate pass or fail, glanceability, actionable, and easy to read
Improvements: only show relevant data, use colors to indicate pass or fail, glanceability, actionable, and easy to read
Improvements: only show relevant data, use colors to indicate pass or fail, glanceability, actionable, and easy to read
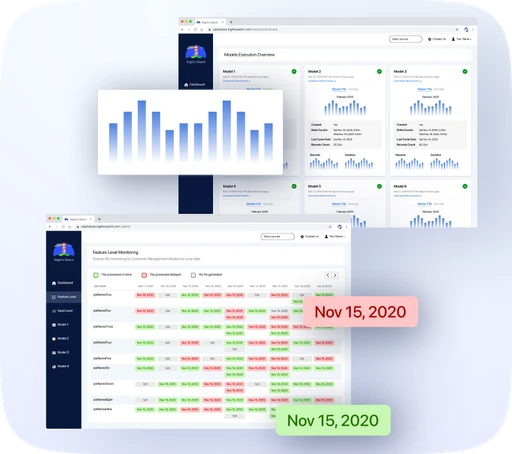
Model Execution Overview Design
Model Execution Overview Design
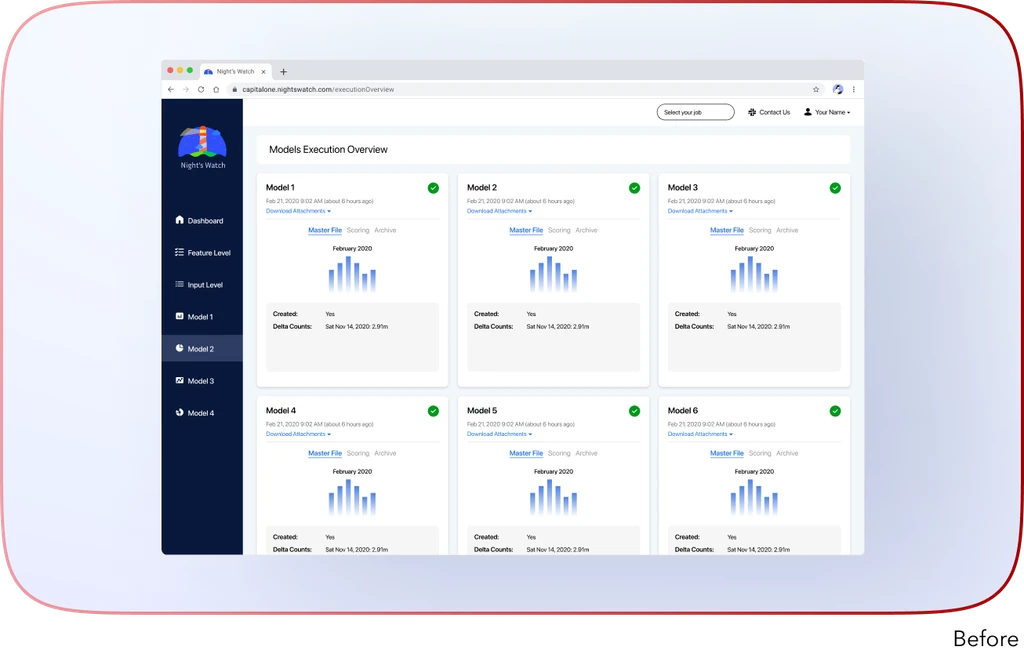
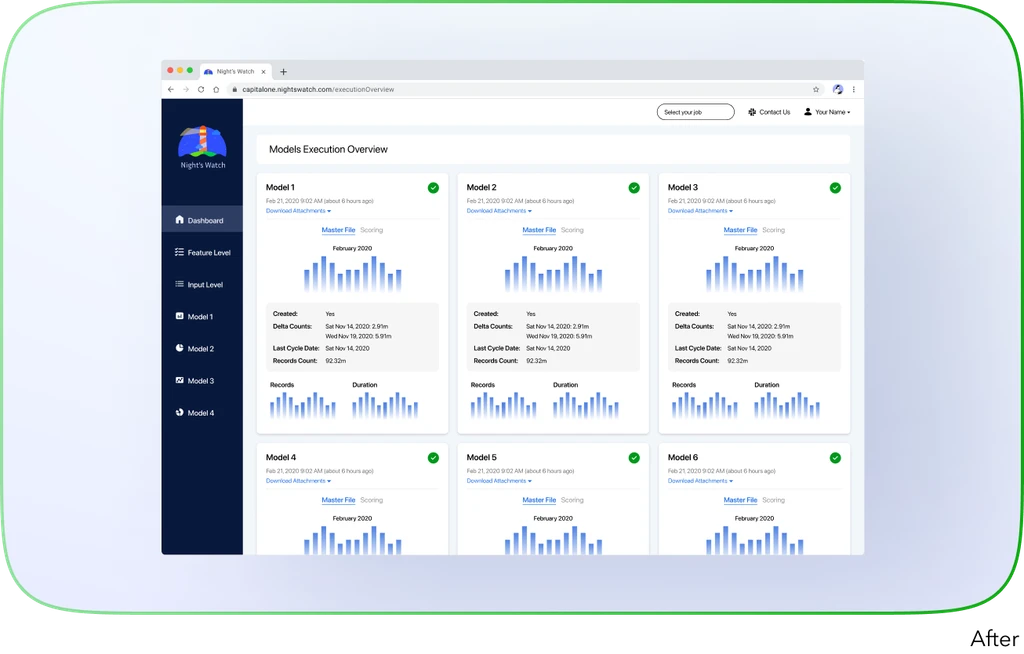
Improvements: addition of charts, glanceability of failing or passing model runs, and additional important information
Improvements: addition of charts, glanceability of failing or passing model runs, and additional important information
Improvements: addition of charts, glanceability of failing or passing model runs, and additional important information
Group Level Monitoring & Input Level Monitoring Designs
Group Level Monitoring & Input Level Monitoring Designs
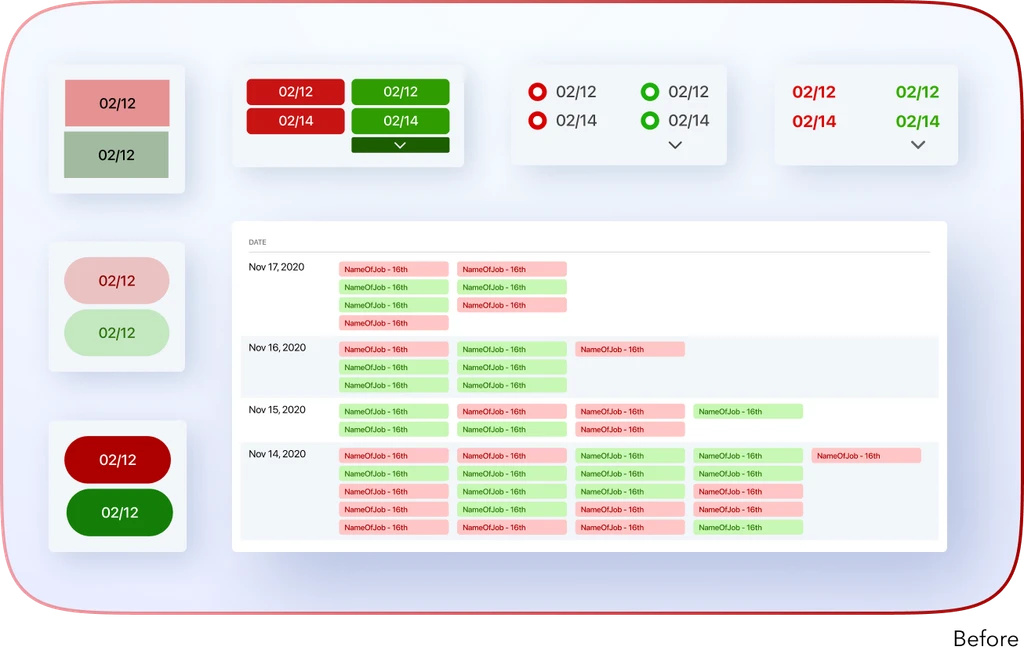
Improvements: table design, date placement, showing lots of runs, indicating passes or failures, and information digestability
Improvements: table design, date placement, showing lots of runs, indicating passes or failures, and information digestability
Improvements: table design, date placement, showing lots of runs, indicating passes or failures, and information digestability
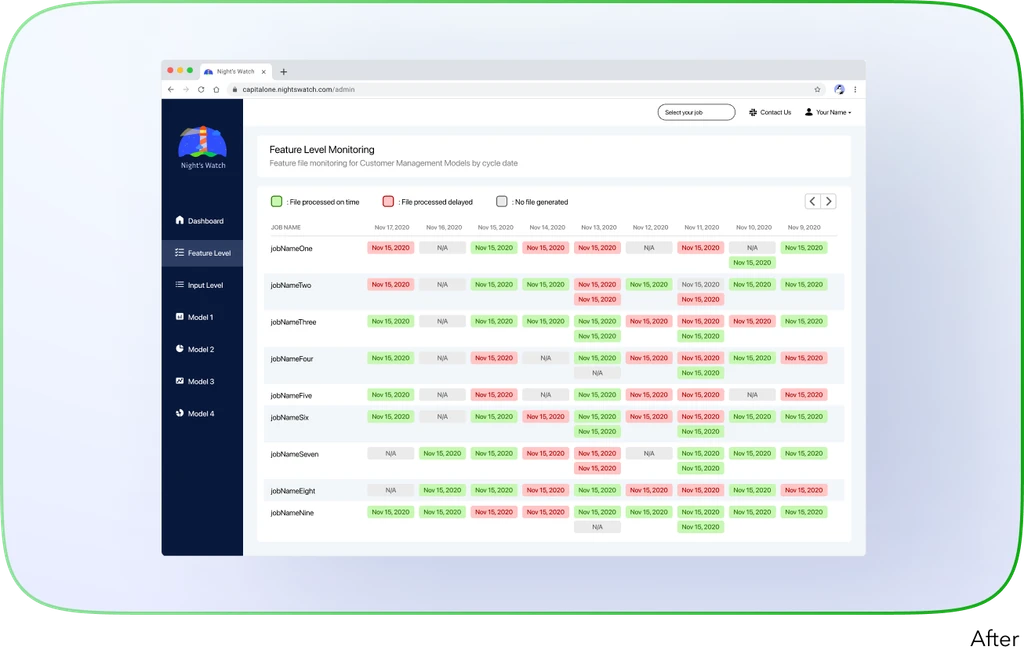
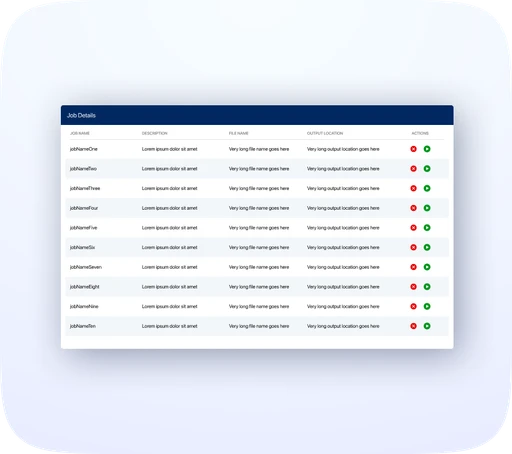
Admin Page Design
Admin Page Design

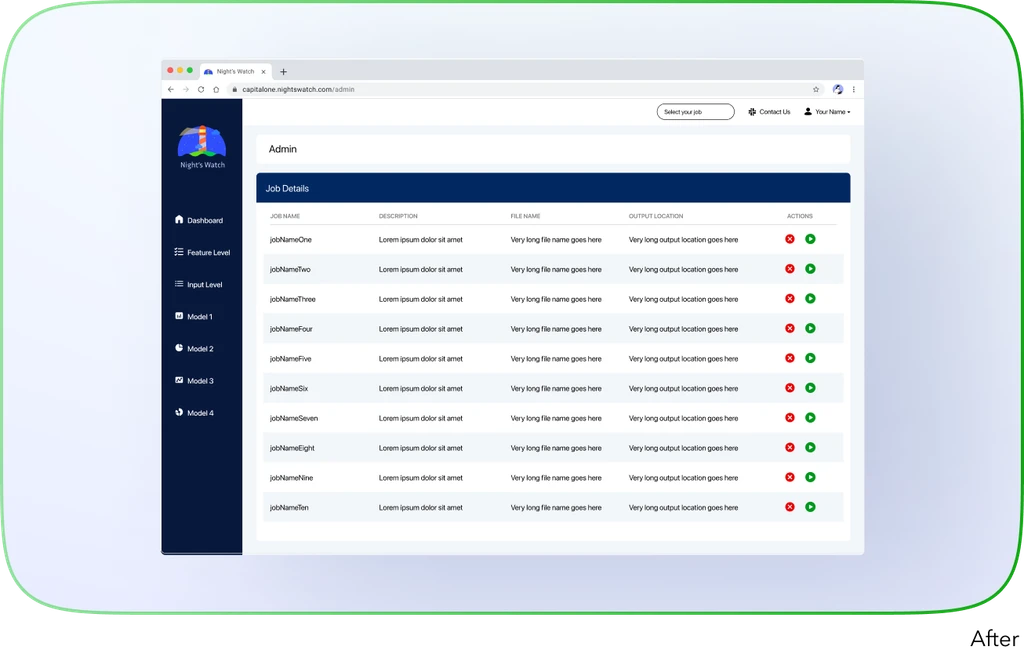
Improvements: only show relevant information, quick actions available immediately, and easier to read
Improvements: only show relevant information, quick actions available immediately, and easier to read
Improvements: only show relevant information, quick actions available immediately, and easier to read
✨ Features & Final Designs
✨ Features & Final Designs
✨ Features & Final Designs
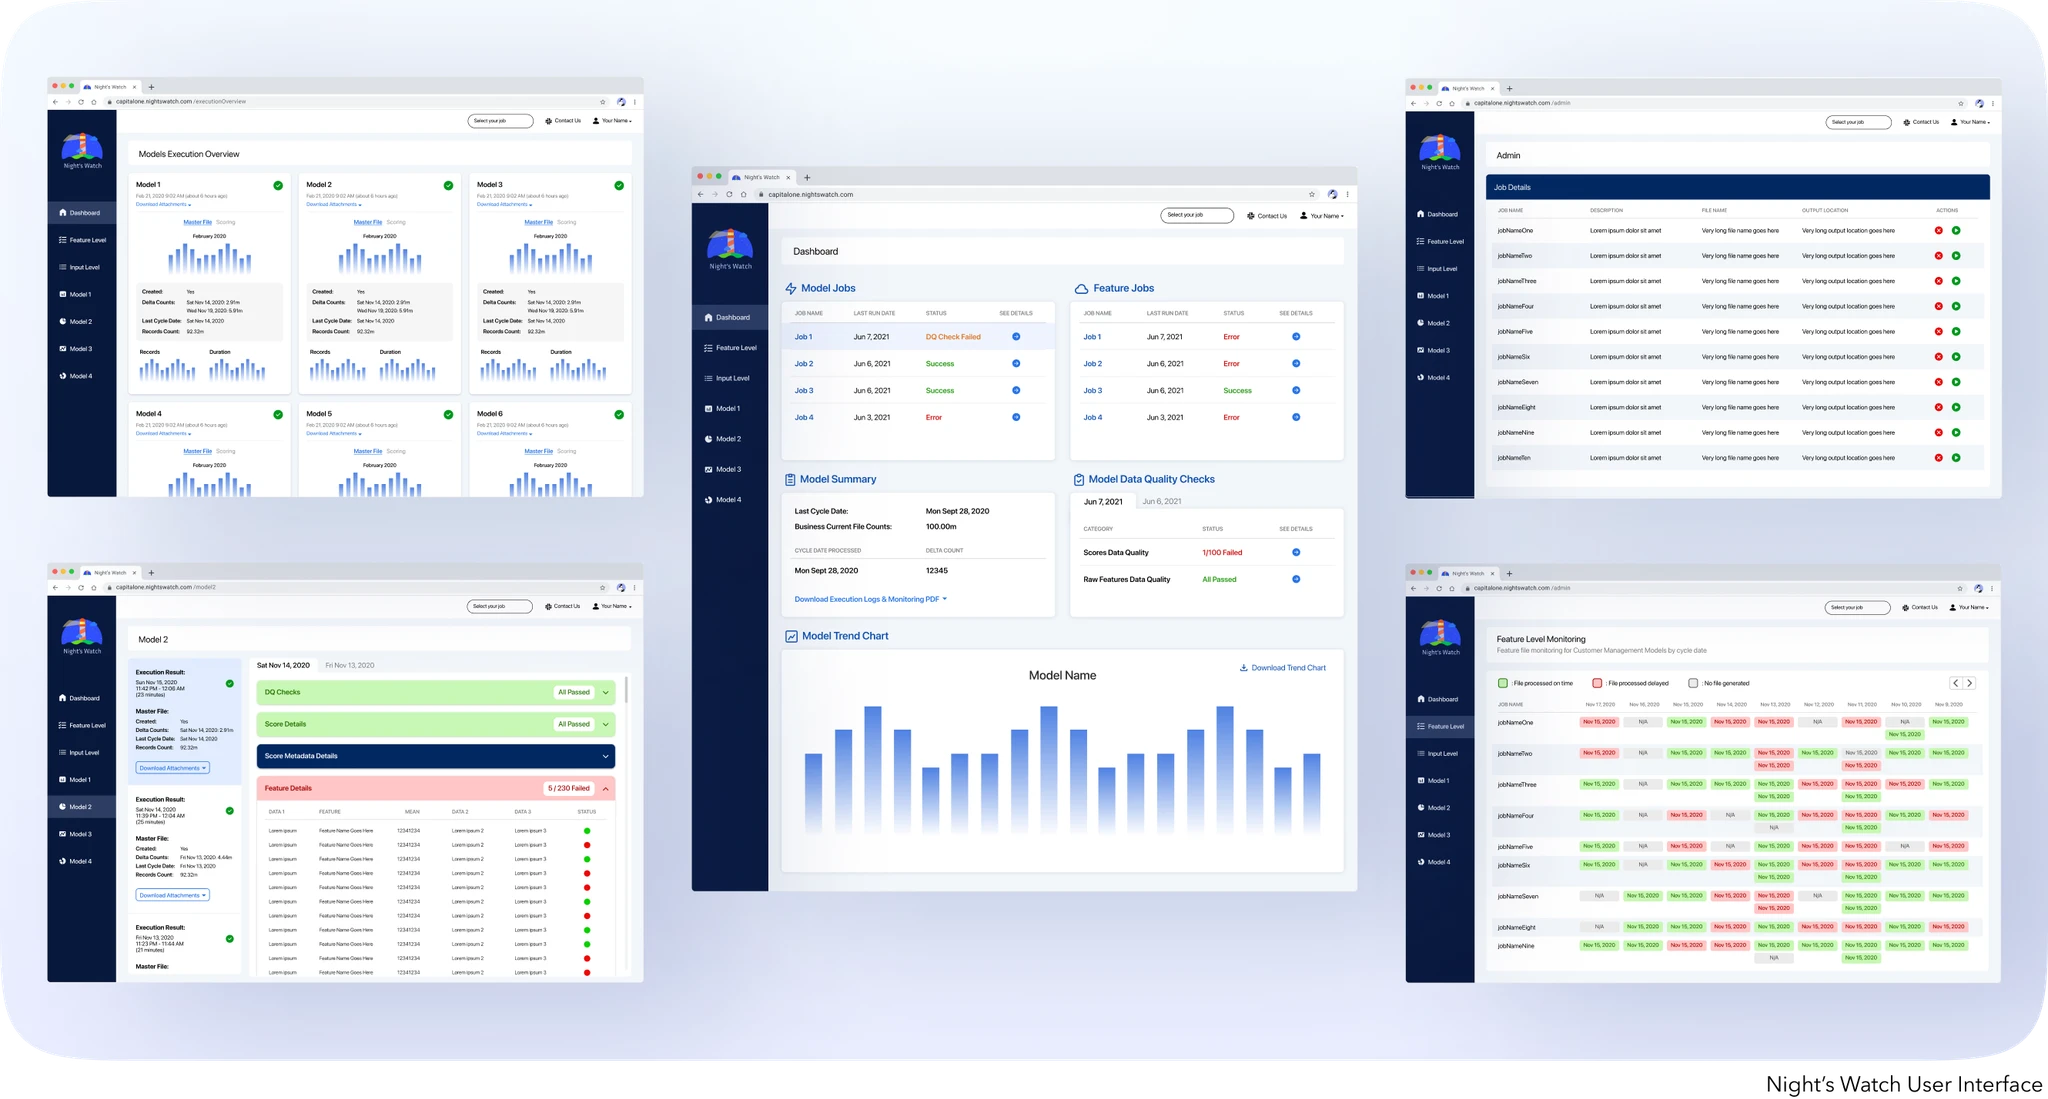
Key Features
Key Features

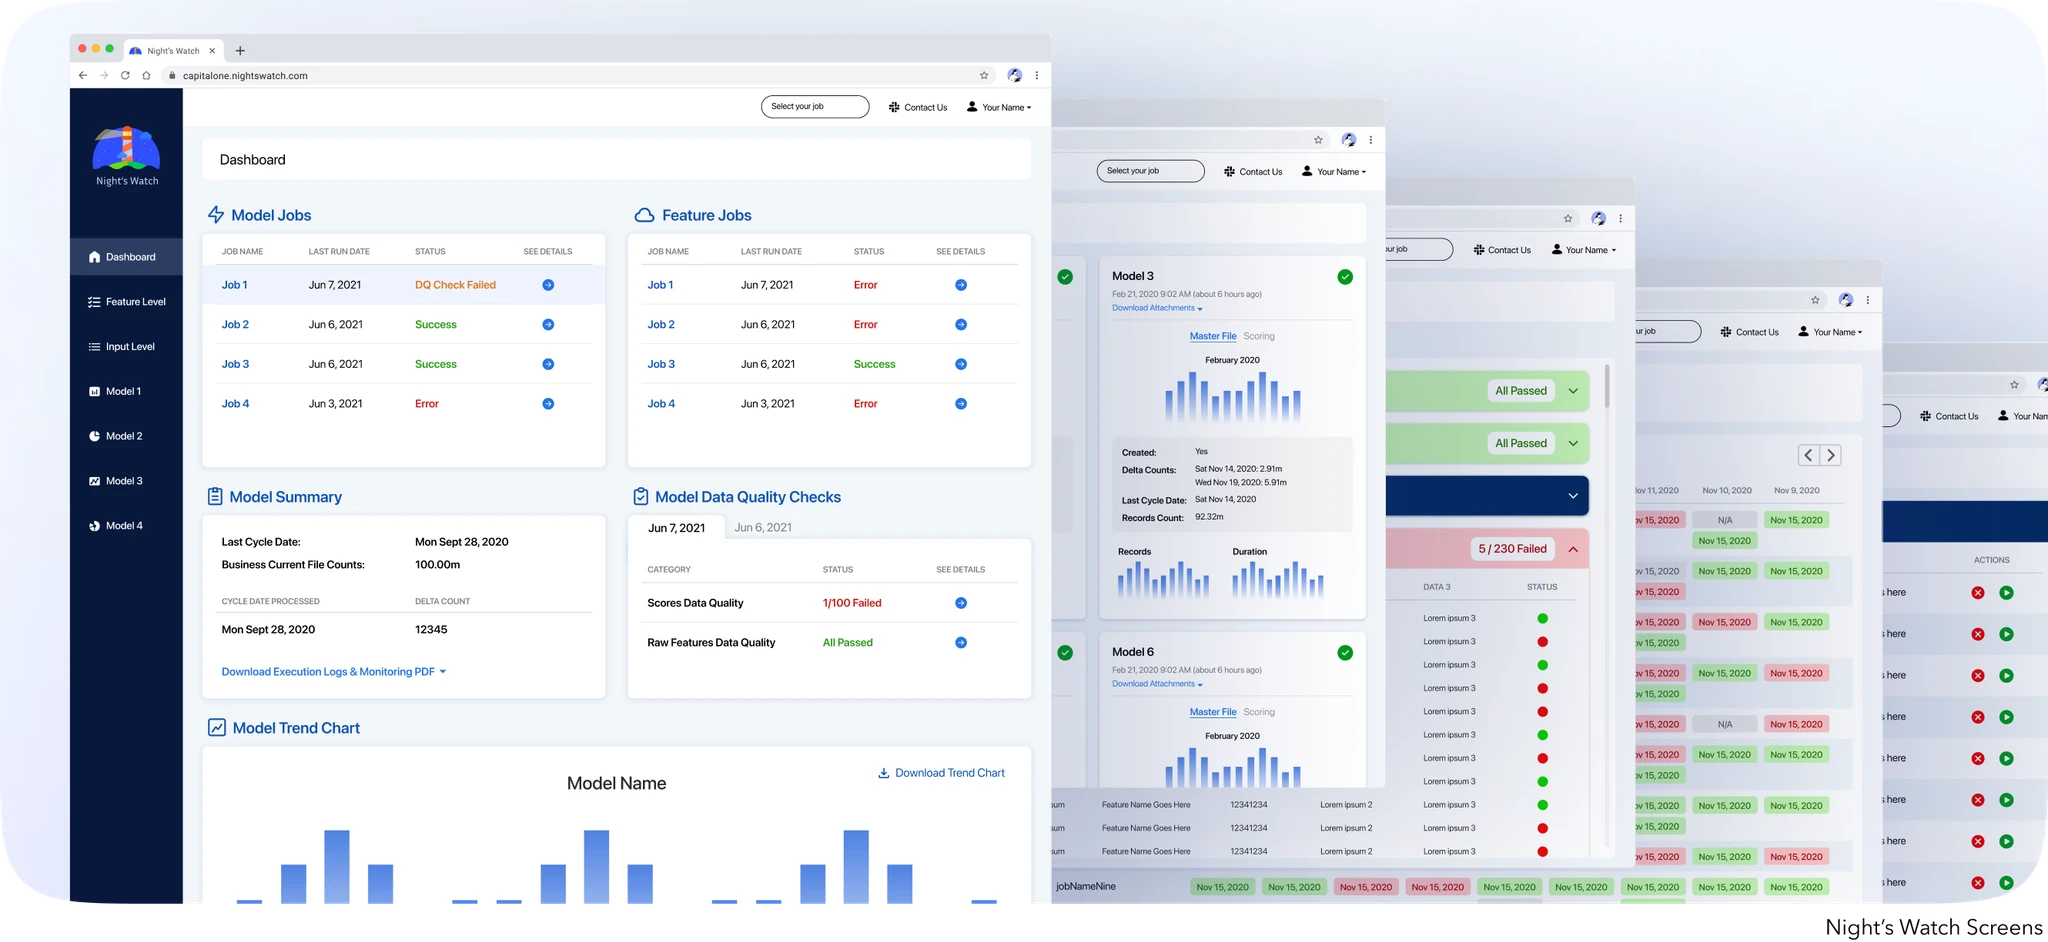
dashboard shows a quick snapshot
dashboard shows a quick snapshot
dashboard shows a quick snapshot
preventive and actionable controls
preventive and actionable controls
preventive and actionable controls
click into increasingly more granular detail
click into increasingly more granular detail
click into increasingly more granular detail
glanceable historical data trackers and trend views using colors and view heirarchy
glanceable historical data trackers and trend views using colors and view heirarchy
glanceable historical data trackers and trend views using colors and view heirarchy
admin console for more control and actions
admin console for more control and actions
admin console for more control and actions
quick access through the sidebar navigation
quick access through the sidebar navigation
quick access through the sidebar navigation
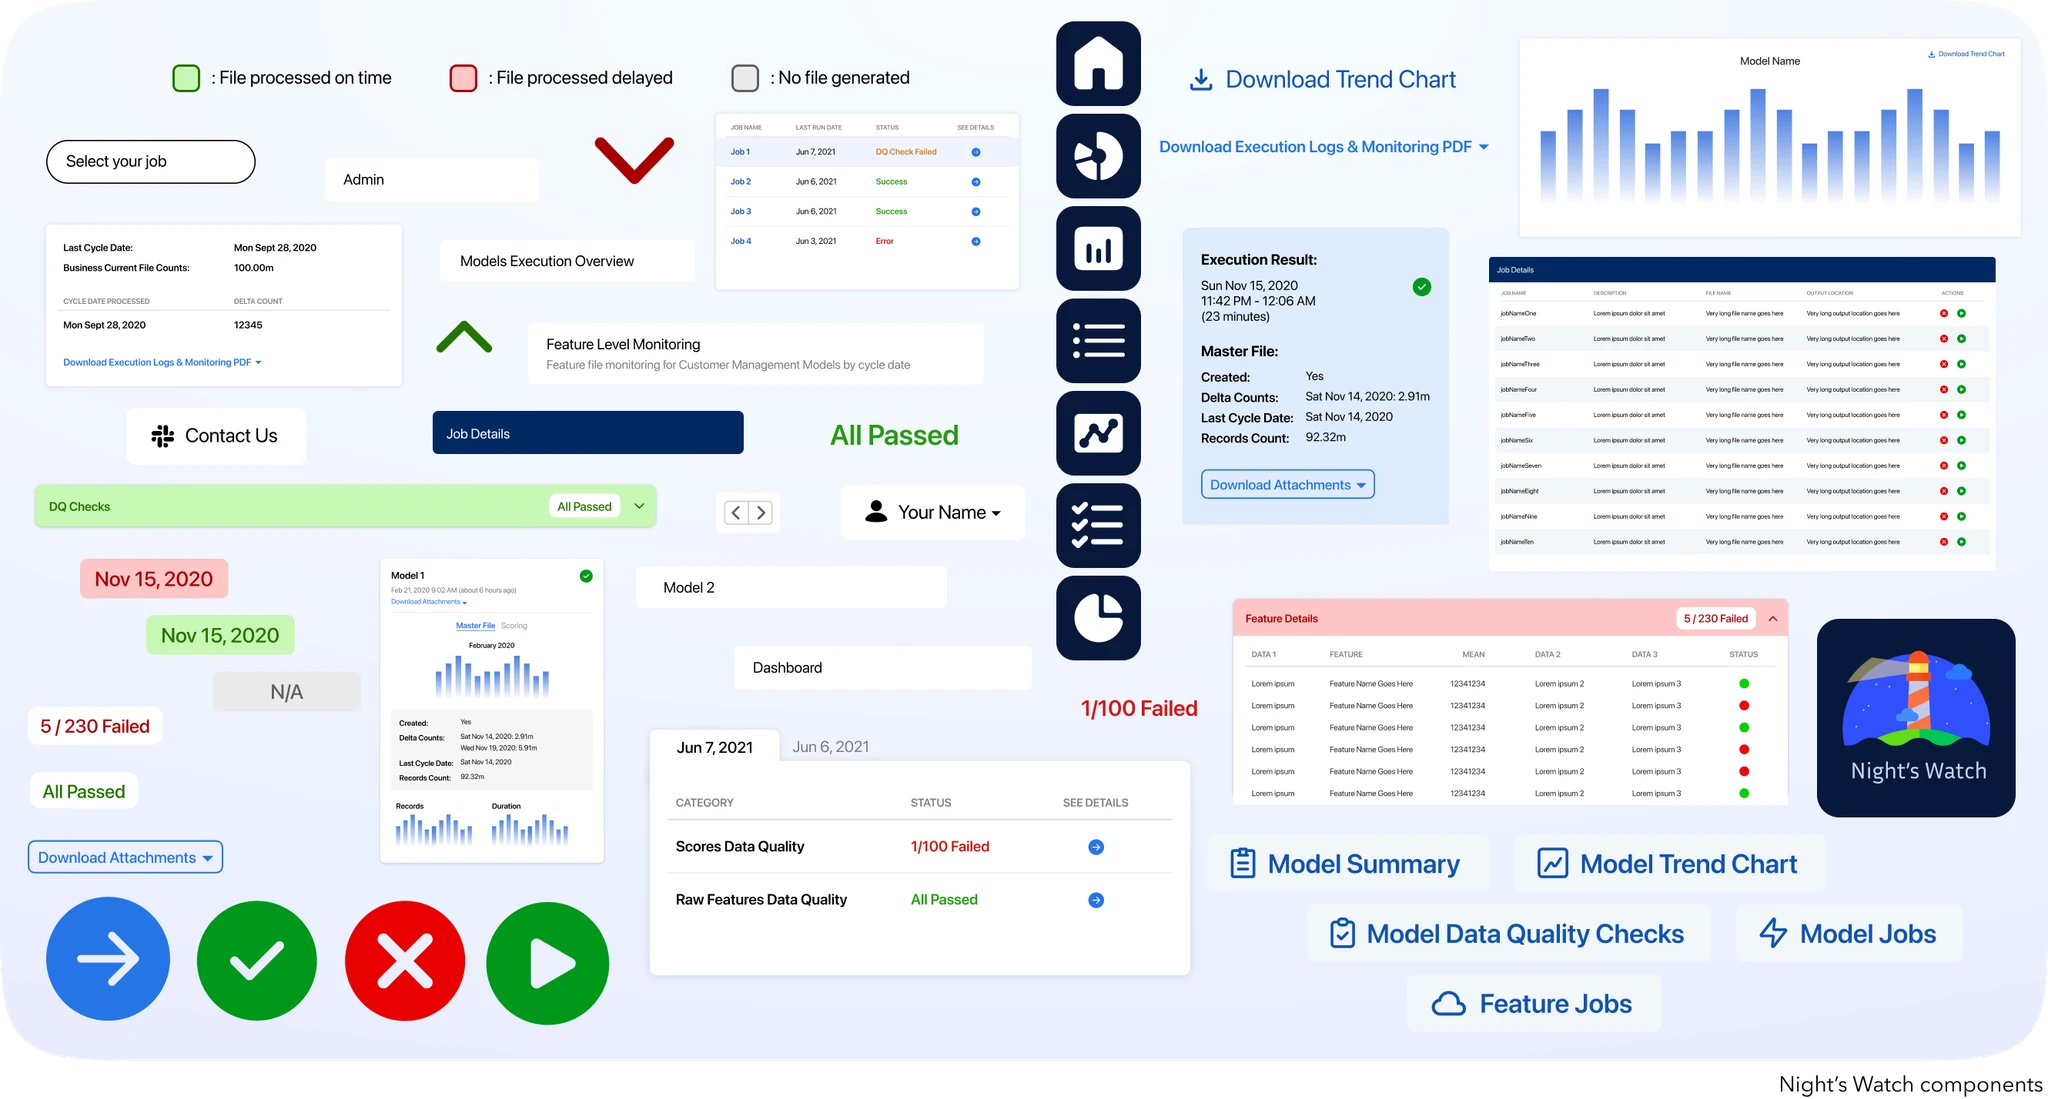
Final Designs
Final Designs
✨ Developer Handoff
✨ Developer Handoff
✨ Developer Handoff
Developer handoff was quite easy because the only developer to hand it off to was me and my tech lead. Everyone else on the team were backend engineers so they were crucial in the research phase to understand what the key features should be. I was able to introduce new design concepts and tools such as Human Centered Design and Figma to my team for easier understanding and collaboration. The application was designed in a feature by feature case where I would design a feature, host usability testing, make iterations, and then develop once approved. This was how I was able to design and develop rapidly within a year.
Developer handoff was quite easy because the only developer to hand it off to was me and my tech lead. Everyone else on the team were backend engineers so they were crucial in the research phase to understand what the key features should be. I was able to introduce new design concepts and tools such as Human Centered Design and Figma to my team for easier understanding and collaboration. The application was designed in a feature by feature case where I would design a feature, host usability testing, make iterations, and then develop once approved. This was how I was able to design and develop rapidly within a year.
Developer handoff was quite easy because the only developer to hand it off to was me and my tech lead. Everyone else on the team were backend engineers so they were crucial in the research phase to understand what the key features should be. I was able to introduce new design concepts and tools such as Human Centered Design and Figma to my team for easier understanding and collaboration. The application was designed in a feature by feature case where I would design a feature, host usability testing, make iterations, and then develop once approved. This was how I was able to design and develop rapidly within a year.
✨ Reflections
✨ Reflections
✨ Reflections
Next Steps
Next Steps
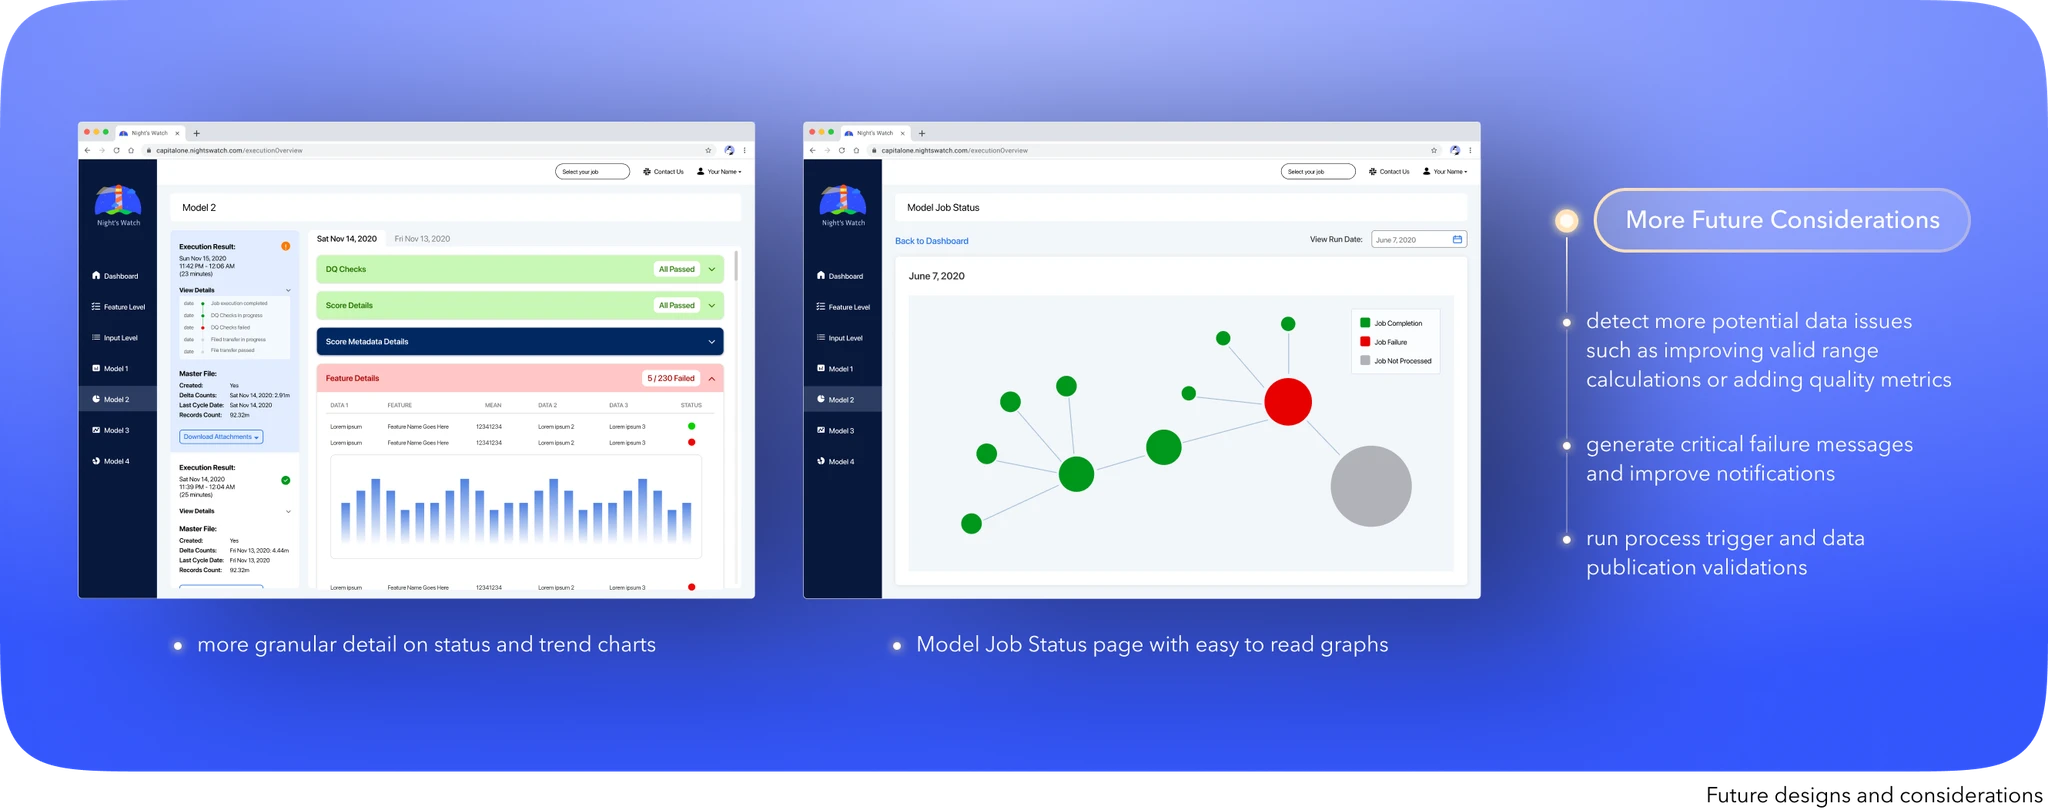
The biggest future initiative for this project that would have started in 2021 were to expand and allow other teams to onboard onto our application. I continued to design for future features such as above. At the time, I was part of the rotational Technology Development Program at Capital One where I would join a new team after one year of being on my first team. Therefore, I sadly had to say goodbye to my amazing team and embark on new adventures to design and develop the native iOS Document Center Hub.
My time on this team was my first software engineering role in my career, and I was very lucky to continue to integrate my passion in design with my job. I learned a lot of software engineering skills and understood the importance of how design and engineering go hand in hand. Realizing that collaboration is key helped me in my next role at the company, continuing my path as a designer and developer. The Night’s Watch application was ultimately used everyday by the engineers on my team, other external teams, and data science teams. It increased team efficiency and saved lots of time for our engineers. Looking back now, I would make changes and improve the feature further, starting with complying with the new enterprise design system and my increased understanding of UI/UX design. That’s all for this project, and thank you for your time!
💫 case studies
© 2025– Cecilia Yeji Kim
made with love and iced strawberry matcha lattes 🫶🏼🧊🍓🍵
💫 case studies
© 2025– Cecilia Yeji Kim
Made with love and
iced strawberry matcha lattes ✨🫶🏼🍓🍵
💫 case studies
© 2025– Cecilia Yeji Kim
Made with love and
iced strawberry matcha lattes ✨🫶🏼🍓🍵